Category Archives: Illusions
Moving Sawteeth
As the moving ramp waveforms move back and forth they appear to change in brightness. As they move to the right, the upper field seems to brighten (and look slightly yellow) and the lower field seems to dim (and look slightly blue). A fixed retinal receptor viewing the upper half will see continuous brightening ramps punctuated by sudden drops. Probably, visual nonlinearities reduced the effectiveness of the sudden drops, so the ramping brightness predominates. (Cavanagh & Anstis, Vision Research 1986)
When the stripes move steadily to the right, the upper field looks apparently brighter. Adapt for ~20s, then click the Pause button. You will see a leftward motion aftereffect, plus a ‘ramp aftereffect’ of apparent dimming in the upper half and apparent brightening in the lower half.
Blurred disc vs. Edges
A flickering contour is a much more effective adaptor than a flickering blurred surface. Gaze at the center spot and view the flickering adapting stimuli, on the left a ring and on the right a blurred surface. Following adaptation, the left test disk disappears while the right disk remains visible. Adapting to the flickering contour leads to contour erasure, while adaptating to the surface does not.
Half Moon Illusion
Incomplete contour erasure can affect the perceived brightness of a uniformly filled light grey disk. First adapt to the flicker of the semicircle, presented superimposed on the left edge of the disk. Following flicker adaptation, not only has the left edge of the disk disappeared, but also a brightness gradient is apparent, making the disk appear like a half moon. In the absence of edge information on the left half of the disk, the brain appears to interpolate the brightness levels from the unadapted right edge to the background level.
Footsteps
Perception · Vol. 30 · 2001 · pp. 785–794
Footsteps and Inchworms: Illusions Show That Contrast Affects Apparent Speed
Abstract
A horizontal grey bar that drifts horizontally across a surround of black and white vertical stripes appears to stop and start as it crosses each stripe. A dark bar appears to slow down on a black stripe, where its edges have low contrast, and to accelerate on a white stripe, where its edges have high contrast. A light-grey bar appears to slow down on a white stripe and to accelerate on a black stripe. If the background luminances at the leading and trailing edges of the moving bar are the same, the bar appears to change speed, and if they are different the bar appears to change in length. A plaid surround can induce 2-D illusions that modulate the apparent direction, not just the speed, of moving squares. Thus, the motion salience of a moving edge depends critically on its instantaneous contrast against the background.
1 Introduction
A stationary surround can profoundly affect our perception of moving objects. The motion of a slowly moving single point of light is difficult to see in a completely dark room. But add a single stationary point of light, and the threshold for seeing motion falls by a factor of five or ten (Tyler and Torres 1972). In other words, relative motion is far easier to see than absolute motion (at least in foveal vision), and as well as being easier to see it also looks faster. For instance, when a horseman rides at constant speed across a field and into the trees, he seems to be moving much faster when he is among the trees, which act as stationary landmarks. In general, landmarks decrease the motion detection threshold. In addition, objects moving at above-threshold speeds appear to move faster when the stationary background is textured rather than featureless.
In this paper the author shows that nonuniform surrounds can cause the instantaneous apparent speed to vary from moment to moment. Specifically, an object that moves across a striped surround can appear to stop and start as it crosses each stripe. These local interactions between object and surround depend critically upon their relative luminances.
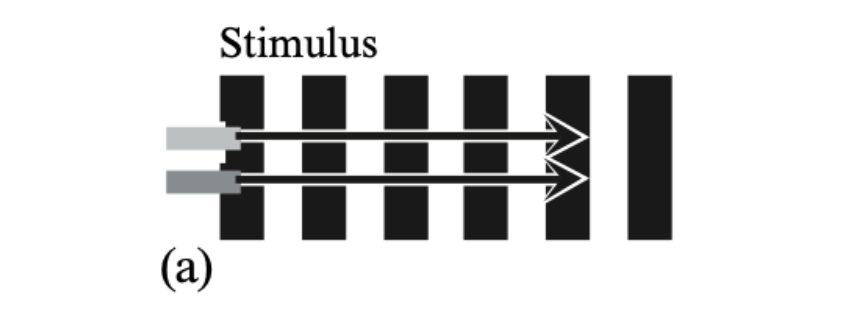
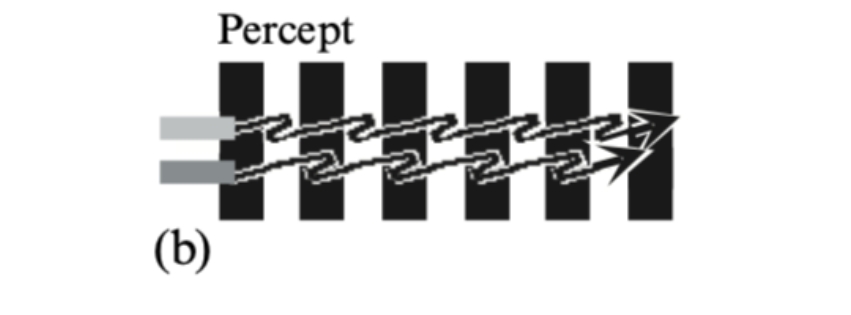
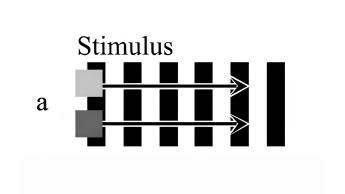
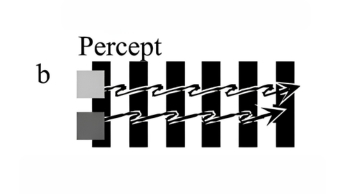
When a horizontal grey rectangle moved at constant speed across a stationary vertical grating of black and white stripes, the rectangle appeared to vary in speed, apparently hesitating or even stopping as it traversed each spatial cycle of the grating. The effect was moderate in foveal vision but robust and unmistakable if the pattern was optically blurred or viewed in peripheral vision. A light-grey rectangle and a dark-grey rectangle drift to the right at the same speed across a grating of vertical bars. Both move at the same uniform speed, but each appears to hesitate on every spatial cycle. The light rectangle appears to slow down on the white stripes and speed up on the black stripes; conversely, the dark rectangle appears to speed up on the white stripes and slow down on the black stripes. Their apparent speeds vary in counterphase, so they look like the two feet of a walking man, one speeding up as the other slows down. This is called the ‘footsteps’ illusion.
-

Figure 1a. A light-grey and a dark-grey horizontal bar moving exactly in step across a vertically striped surround (the stimulus for Experiment 1).
-

Subjective appearance of this stimulus. The edges of the light bar appear to speed up on the black stripes and to slow down on
the white stripes. The edges of the dark bar appear to speed up on the white stripes and to
slow down on the black stripes. Consequently the two bars appear to stop and start in alternation, like the two feet of a walker.
-

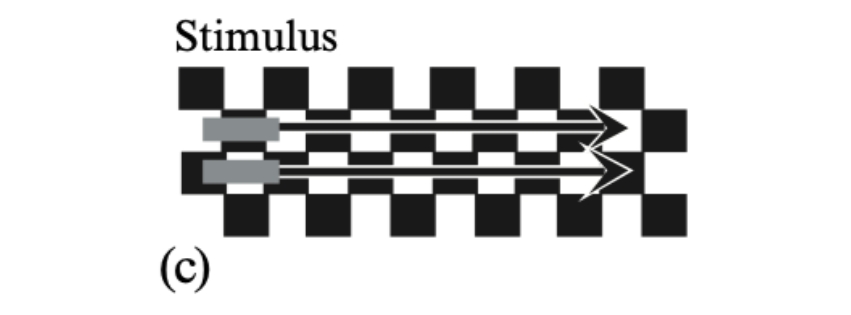
The contrast of the bars matters, not their luminance. On a checkerboard, two identical dark-grey bars travel from left to right.
-

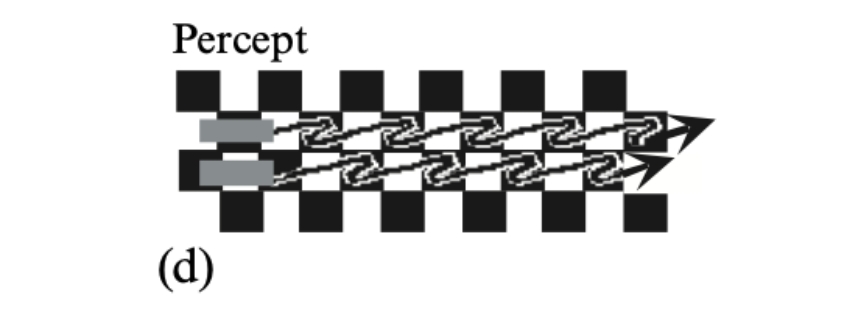
Each of the bars crossing a checkerboard appears to speed up on the white
squares and slow down on the black squares. Thus they appear to stop and start in alternation,
since they lie on squares of opposite polarity. -

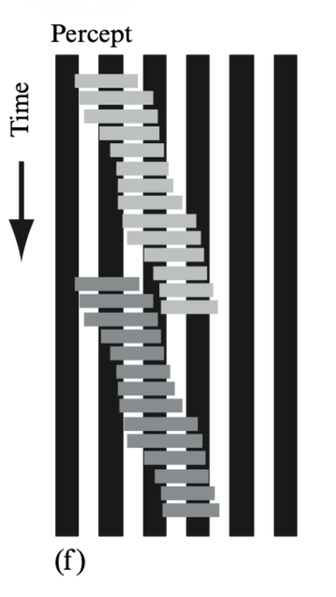
Shows the `inchworm’ effect using a different
convention. Time runs down the page. When the bars are three stripes wide, their leading and trailing edges have different contrasts: when the leading edge is on a black surround the trailing
edge is on white, and vice versa. This was the stimulus for experiment 2. -

Result: the bars appear to change in length as they move along, like inchworms.

1.1 Contrast, not luminance
The relative luminance between bar and surround, rather than the absolute luminances, causes this effect. When two identical dark-grey bars drift over a black/white checkerboard, they appear to stop and start in counterphase, like a pair of footsteps, because their local backgrounds differ: when one bar lies on black squares the other lies on white squares. So although the two bars have the same luminance, they differ in contrast against the surround, and this suffices to produce the footsteps effect.
1.2 Contrast, not polarity
When grey bars move across black and white stripes they change their polarity as well as their contrast. However, polarity reversal is not necessary for the footsteps effect. When a black and a white horizontal bar move across light-grey and dark-grey vertical stripes, the footsteps illusion is still present even though the bars never change their polarity. This shows that a change of figure–ground contrast is sufficient to modulate perceived speed.
2 Experiment 1: The ‘Footsteps’ Illusion
2.1 Method
In all experiments, observers fixated on a point on a computer-controlled monitor screen from a distance of 57 cm in a dimly lit room, and the stimuli moved along a horizontal path lying 5° above the fixation spot. The display comprised a stationary black and white grating of vertical stripes with a square-wave luminance profile at a spatial frequency of 0.79 cycle deg⁻¹. A horizontal grey bar (height 0.63°, width 1.26°) moved smoothly and repetitively to the right across this striped background at a velocity of 2.25 deg s⁻¹. The moving bar was exactly two stripe widths in horizontal extent, so its left and right edges always lay on the same background luminance at all times. Five observers were run.
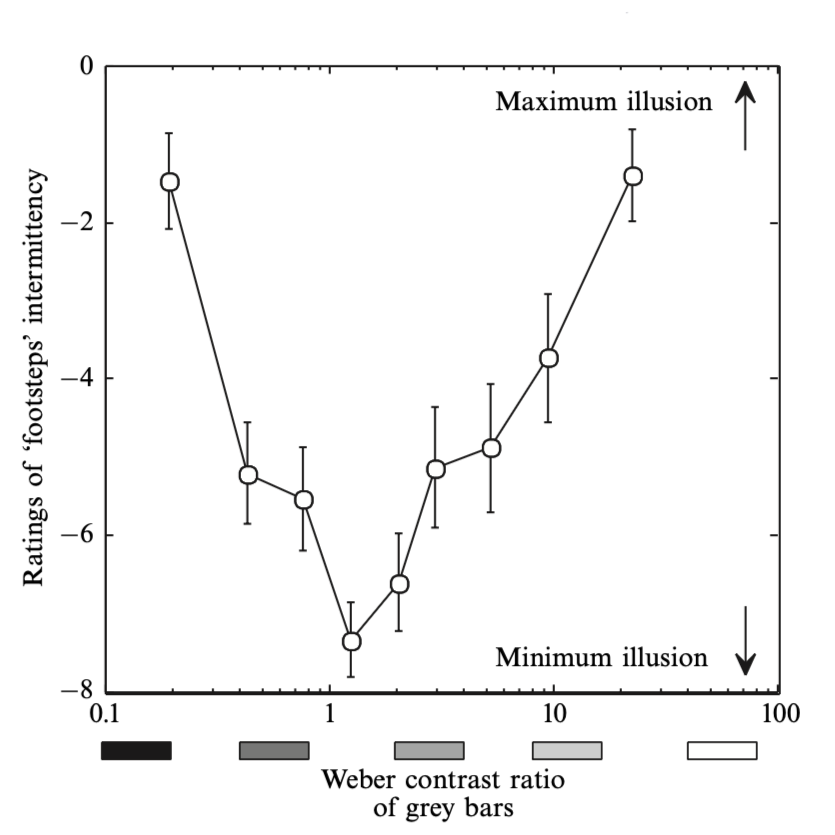
The drifting bar was set to one of ten different luminances in random order, ranging from near-black to white. Observers rated the apparent smoothness of the bar’s motion on a scale of 0 (repetitively coming to a complete halt) to 10 (constant velocity, no illusion). The key measure was the Weber contrast ratio (CR) of the bar on white stripes versus black stripes:
CR = abs( (L_b − L_g) / L_g ) / ( (L_w − L_g) / L_g ) = abs( (L_b − L_g) / (L_w − L_g) )
where Lb, Lw, and Lg refer to the luminances of the black stripes, white stripes, and grey bar respectively. A mid-grey bar at the arithmetic mean of black and white yields a contrast ratio near unity, predicting no illusion; bars approaching black or white yield large contrast ratios, predicting strong illusions.
2.2 Results
The illusion was maximal—with the bar slowing to an almost complete standstill—when the bar was almost black or almost white. At mid-greys the illusion was reduced but still present. In other words, the bars that changed most in luminance contrast showed the greatest changes in apparent speed.
3 Experiment 2: The ‘Inchworm’ Illusion
In Experiment 1 the horizontal width of the drifting bars equalled one spatial period—two stripe widths—so that the leading and trailing edges always lay on the same background luminance. The bars were now made three stripes wide, so the leading and trailing edges appeared to speed up and slow down in alternation, and the whole bar appeared to change in length and inch its way along like a caterpillar or inchworm. For a light-grey bar, when its leading edge lay on a white stripe it had low contrast and appeared to slow down, while simultaneously its trailing edge lay on a black stripe with high contrast and appeared to speed up. Consequently the rear edge tended to partially catch up with the front, and the bar appeared to contract. The reverse produced apparent expansion.
3.1 Method
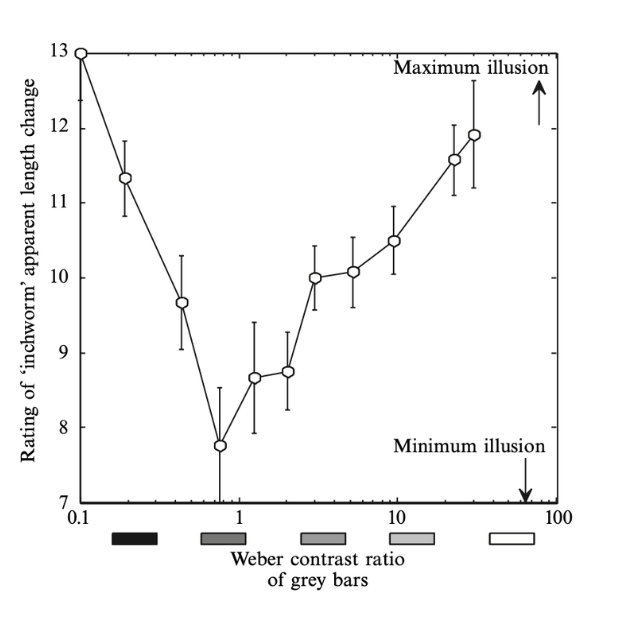
The display and procedure were much the same as before except that the grey bars were now three stripes wide. A standard dark-grey bar (13.5% of white) moved left to right at 2.25 deg s⁻¹ along a 7.25° path positioned 5° above the fixation point. A comparison bar moved right to left along a path 5° below fixation to prevent the bars from perceptually locking together. Observers rated the perceived expansion and contraction of the variable-luminance bar relative to the fixed standard, using the standard’s degree of expansion and contraction as the reference value of 10.
3.2 Results
The inchworm effect was strongest for the very lightest and darkest bars, often exceeding the ratings of the standard bar, and reached a maximum rating of 13 for a white bar. The illusion was reduced, though still present, for mid-grey bars. The curves for the inchworm and footsteps illusions are similar in general appearance: illusions were greatest for extreme contrast-ratio values (black and white bars), and both illusions were minimal for a mid-grey bar with a contrast ratio near unity.
4 Experiment 3: Illusion Not Caused by Brightness Induction
Several observers noted that the grey bars appeared to change in brightness as they moved over the stationary stripes—looking lighter when passing over a black stripe and darker over a white stripe. These changes, caused by simultaneous brightness induction, raised the question of whether phantom spots (as in the Hermann grid or McCourt’s induced gratings) might be responsible for the illusions. To test this, observers dark-adapted for 10 min with a 3.3 log unit neutral density filter and then viewed the footsteps stimulus. The result was that the footsteps illusion was just as strong with the filter as without: mean rated illusion was 10.0 when light-adapted and 10.2 (SE = 1.71) when dark-adapted. Changes in perceived brightness were therefore ancillary to the illusion, not a critical determinant of it.
5 Experiment 4: 2-D Plaids Modulate Perceived Direction of Motion
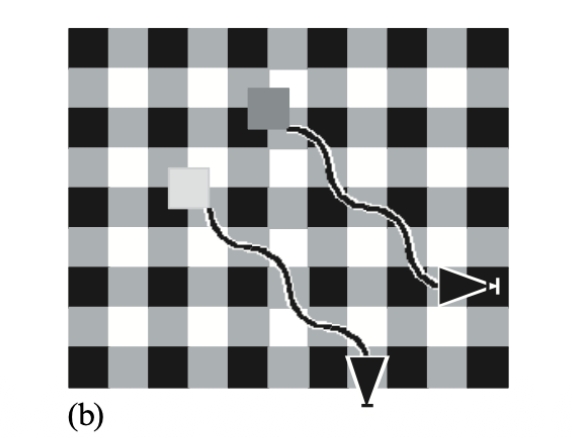
Two orthogonal square-wave gratings were superimposed to make a stationary background plaid composed of black, white, and mid-grey squares. Two moving squares—one light grey, one dark grey—moved in synchrony along parallel oblique paths at 45° to the orientation of the plaid. All five naïve observers reported that the two spots seemed to wiggle in and out toward each other, changing their directions repetitively as they pursued their common oblique path.
The explanation relies on vector averaging. When the dark square moved across a ‘corner’ of the plaid where one edge entered a darker vertical stripe, the rightward component of motion appeared to slow (low contrast); simultaneously its lower edge entered a lighter horizontal stripe, so the downward component appeared to speed up (high contrast). The square seemed to veer toward the vertical. At the next corner, with opposite luminance polarities, it veered toward the horizontal. The two squares thus appeared to move along counterphasing wiggly paths. Two orthogonal inchworm illusions could occur simultaneously, modulating apparent direction rather than speed alone.
-

Figure 4a: Stimulus: a light and a dark square moving in step along parallel oblique paths across a stationary plaid background.
-

Figure 4b. Artist’s impression of the percept: the squares appeared to change direction, apparently wiggling in and out as they moved along their common oblique trajectory. See text for explanation.

6 Discussion
The footsteps and inchworm illusions depended on contrast. The apparent accelerations and decelerations of the drifting bar were correlated with changes in its luminance contrast. For a dark-grey drifting bar, contrast was low on black stripes and the bar appeared to move slowly; on white stripes the contrast was high and the bar appeared to move rapidly. The reverse held for a light-grey bar.
These results are consistent with a large body of work showing that perceived speed depends on contrast (Thompson 1982; Stone and Thompson 1992; Blakemore and Snowden 1999, among others). The present experiments add that contrast modulation of speed can be rapid—bars appeared to vary in speed at the temporal frequency with which they traversed the stripes (1.8 Hz)—demonstrating that the effects of contrast on speed are local in both space and time.
The illusions tended to be stronger in peripheral than in foveal vision. The greatest illusory variations in speed were found when the drifting bar was almost black or almost white, with maximum change in contrast. A mid-grey bar at the arithmetic mean of the black and white stripes (approximately 52%) showed minimum illusory change in speed; the footsteps and inchworm illusions vanished when both ends of the bar had the same Weber contrast—a purely luminance-linear, not logarithmic, criterion.
What could be the neural substrate? It seems intuitively likely that motion-sensitive neurons would signal less vigorously when contrast is low and respond more briskly to higher-contrast moving patterns. Thiele et al (2000) discovered just such responses in single neurons in macaque visual area MT, and these neural findings could go a long way toward explaining the present illusions.
References
- Anstis S M, 1970 “Phi movement as a subtraction process” Vision Research 10 1411–1430
- Anstis S M, Rogers B J, 1975 “Illusory reversal of depth and movement during changes of contrast” Vision Research 15 957–961
- Anstis S M, Smith D R, Mather G, 2000 “Luminance processing in apparent motion, Vernier offset and stereoscopic depth” Vision Research 40 657–675
- Aubert H, 1886 “Die Bewegungsempfindung” Pflügers Archiv für die Gesamte Physiologie 39 347–370
- Blakemore M R, Snowden R J, 1999 “The effect of contrast upon perceived speed: a general phenomenon?” Perception 28 33–48
- Blakemore M R, Snowden R J, 2000 “Textured backgrounds alter perceived speed” Vision Research 40 629–638
- Bonnet C, 1984 “Discrimination of velocities and mechanisms of motion perception” Perception 13 275–282
- Campbell F W, Maffei L, 1979 “Stopped visual motion” Nature 278 192
- Campbell F W, Maffei L, 1981 “The influence of spatial frequency and contrast on the perception of moving patterns” Vision Research 21 713–721
- Cormack R, Blake R, Hiris E, 1992 “Misdirected visual motion in the peripheral visual field” Vision Research 32 73–80
- Gegenfurtner K R, Hawken M J, 1996 “Perceived velocity of luminance, chromatic and non-Fourier stimuli: Influence of contrast and temporal frequency” Vision Research 36 1281–1290
- Gogel W C, McNulty P, 1983 “Perceived velocity as a function of reference mark density” Scandinavian Journal of Psychology 24 257–265
- Hawken M J, Gegenfurtner K R, Tang C, 1994 “Contrast dependence of colour and luminance motion mechanisms in human vision” Nature 367 268–270
- Johnson C A, Scobey R P, 1982 “Effects of reference lines on displacement thresholds at various durations of movement” Vision Research 22 819–822
- Kooi F K, De Valois K K, Grosof D H, De Valois R L, 1992 “Properties of recombination of one-dimensional motion signals into a pattern-motion signal” Perception & Psychophysics 52 415–424
- Ledgeway T, Smith A T, 1995 “The perceived speed of second-order motion and its dependence on stimulus contrast” Vision Research 35 1421–1434
- Legge G E, Campbell F W, 1981 “Displacement detection in human vision” Vision Research 21 205–214
- Leibowitz H W, 1955 “Effect of reference lines on the discrimination of movement” Journal of the Optical Society of America 45 829–830
- McCourt M E, 1982 “A spatial frequency dependent grating-induction effect” Vision Research 22 119–134
- McCourt M E, 1990 “Disappearance of grating induction at scotopic luminances” Vision Research 30 431–437
- McCourt M E, Blakeslee B, 1994 “Contrast-matching analysis of grating induction and suprathreshold contrast perception” Journal of the Optical Society of America A 11 14–24
- McKee S P, Smallman H S, 1998 “Size and speed constancy” in Perceptual Constancies: Why Things Look Like They Do (New York: Cambridge University Press) pp 373–408
- McKee S P, Welch L, Taylor D G, Browne S F, 1990 “Finding the common bond: Stereoacuity and the other hyperacuities” Vision Research 30 879–891
- Mates B, 1969 “Effects of reference marks and luminance on discrimination of movement” Journal of Psychology 73 209–221
- Smith D R R, Derrington A M, 1996 “What is the denominator for contrast normalization?” Vision Research 36 3759–3766
- Spillmann L, 1994 “The Hermann grid illusion: a tool for studying human perceptive field organization” Perception 23 691–708
- Stone L S, Thompson P, 1992 “Human speed perception is contrast dependent” Vision Research 32 1535–1549
- Thiele A, Dobkins K R, Albright T D, 2000 “Neural correlates of contrast detection at threshold” Neuron 26 715–724
- Thompson P, 1982 “Perceived rate of movement depends on contrast” Vision Research 22 377–380
- Thompson P, Stone L S, 1997 “Contrast affects flicker and speed perception differently” Vision Research 37 1255–1260
- Thompson P, Stone L S, Swash S, 1996 “Speed estimates from grating patches are not contrast-normalized” Vision Research 36 667–674
- Trošcianko T, 1982 “A given visual field location has a wide range of perceptive field sizes” Vision Research 22 1363–1369
- Tyler C W, Torres J, 1972 “Frequency response characteristics for sinusoidal movement in the fovea and periphery” Perception & Psychophysics 12 232–236
- Whittle P, 1992a “The psychophysics of contrast-brightness” in Lightness, Brightness and Transparency (Hillsdale, NJ: Lawrence Erlbaum) pp 111–157
- Whittle P, 1992b “Contrast-brightness and ordinary seeing” in Lightness, Brightness and Transparency (Hillsdale, NJ: Lawrence Erlbaum) pp 35–110
- Wist E R, 1976 “Dark adaptation and the Hermann grid illusion” Perception & Psychophysics 20 10–12
Neural Networks · Vol. 16 · 2003 · pp. 933–938 · Special Issue
Moving Objects Appear to Slow Down at Low Contrasts
Abstract
Moving cars give the illusion of slowing down in foggy conditions, because low contrast reduces perceived speed. A grey square that drifts horizontally across a surround of black and white vertical stripes appears to stop and start as it crosses each stripe, because its contrast keeps changing. A moving square whose vertical and horizontal edges have different contrasts will show illusory distortions in perceived direction. Contrast also affects the apparent amplitude and salience of back-and-forth apparent motion. Finally, a line of black and white dots on a grey surround moves in illusory directions, because of a mismatch in the contrasts along and across the dotted line. Thus, motion signals in the early parts of the visual system are profoundly altered by stimulus luminance and contrast. This suggests that motion is coded by the relative firing rates of neural channels tuned to fast and slow motion, with contrast-dependence being a motion analog of the Bezold–Brücke hue shift.
Keywords: Contrasts · Luminance · Motion perception · Speed perception
1 Introduction
Motion perception allows us to keep track not only of moving objects, but also of our own movements through space. It also provides valuable raw material for neural modelers. Motion perception is one of the most ancient and primitive forms of vision: a hungry frog will starve to death on a heap of plump dead flies, but if one is jerked around on a fishing line, the frog will immediately snap it up. Motion plays a crucial part in the constant arms race between predators and prey.
The range of speeds visible to humans is an impressive 1000:1. The moon’s slow sail across the sky is just barely too slow to see, moving through its own diameter in about 2 minutes. The fastest resolvable speed is roughly a thousand times greater, depending on illumination and adaptation.
Car accidents are the leading cause of death for people aged 5–44, and fog is a contributing factor in approximately 1,200 vehicle accidents per year in Wisconsin alone, with national winter-related road deaths averaging 950 annually. Many anecdotes suggest that during fog, other cars—and even one’s own car—appear to move more slowly than their actual speeds. The author’s recent findings attribute both phenomena to the fact that objects appear to move more slowly when they are low in contrast, as they are in fog. In fog, other cars are reduced in contrast and so appear slower. Also, a driver judges speed largely by visual cues from the landscape sliding past in peripheral vision; fog reduces the contrast of that passing landscape, making it appear to slip by more slowly.
2 Results
It is known that apparent speed varies with contrast. The author presents novel, direct demonstrations of these illusory changes in apparent speed. Two squares—one light grey, one dark grey—moved horizontally at constant speed across a stationary surround of vertical stripes. Each square was exactly two stripe widths in diameter, so that its front and back edges always lay on the same color. The two squares appeared to stop and start in alternation, depending upon their local contrast. When the dark grey square lay on white stripes it had high contrast and appeared to speed up; when it lay on black stripes it had low contrast and appeared to slow down. The opposite was true for the light grey square. This is the ‘footsteps illusion’ (Anstis 2001).
-

Figure 1a. Stimulus for the footsteps illusion: a light and a dark grey square move together at constant speed across stationary vertical stripes.
-

Figure 1b. Percept: as the squares alternately change from high to low contrast against the stripes, they seem to alternate between high and low speeds, like walking feet.
Footsteps illusion is still seen. (With AKIYOSHI KITAOKA)
-
Figure 2a. Grey square moves horizontally across black and white checkers.
-
Figure 2b. Grey square moves horizontally, with its bottom edge touching a row of black and white checkers
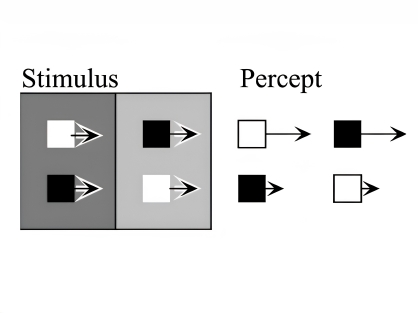
Contrast affects not only smooth real movement, but also stroboscopic apparent movement. A black square and a white square, one above the other, jumped back and forth horizontally through a distance of one-quarter of the square’s width. On a dark surround, the white square appeared to jump through a greater distance; on a light surround, the black square appeared to jump further. In both cases, the square with higher contrast against the surround appeared to move more. This effect altered the apparent amplitude of motion, not its apparent speed, and was not simply a misperception of endpoint positions, since separate experiments showed that judged positions of stationary squares were unaffected by contrast.
In a further demonstration using stroboscopic motion, two vertical bars—one black, one white—lie side by side on a grey surround. When they abruptly exchange luminances, the perceived motion direction depends on the surround luminance: on a light grey surround the black bar appears to jump; on a dark grey surround the white bar appears to jump. In other words, the bar with higher contrast against the surround appears to jump. The two bars generate motion signals in opposite directions, but the stronger signal wins in a winner-take-all outcome—analogous to two overlapping gratings drifting in opposite directions, where the higher-contrast grating dominates. Perceived motion vanished when the surround was mid-grey at the arithmetic mean of black and white, equalizing the Michelson contrasts of the two bars. Notably, only the amount of contrast mattered, not its polarity.
-
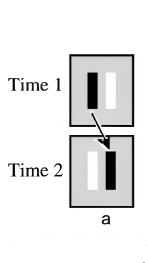
Figure 4a. On a light grey surround the black bar appears to jump when the two bars exchange luminances.
-
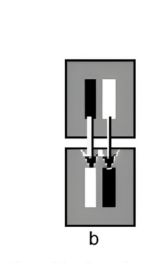
Figure 4b. A mid-grey surround yields little perceived motion.
-

Figure 4c. On a dark grey surround the white bar appears to jump.
-

Figure 4d-4e. Embedding bars influence motion more than the surrounding field does: contrast against the embedding lines, not the rest of the surround, determines which bar appears to jump.
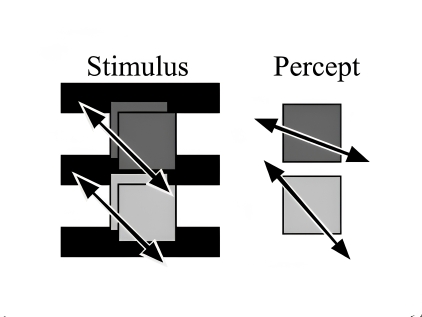
Contrast-based motion illusions can also be applied to different parts of a single moving object. Two squares—one light grey, one dark grey—jumped obliquely at 45° across a horizontally striped surround arranged so that their top and bottom edges contacted black stripes (low contrast for the dark square, high for the light) while their left and right edges contacted white stripes (high contrast for the dark square, low for the light). The result was that the dark square appeared to move between 10 o’clock and 4 o’clock, while the light square appeared to move between 11 o’clock and 5 o’clock. Contrast thus alters the perceived direction of motion as well as its perceived speed.
Ends of lines
Two extreme cases show that the ends of a moving line are far more important in determining its seen motion than the middle part.
(1) A new peripheral-oblique phenomenon shows that motion perception is more contrast-dependent in the periphery than in central vision. An oblique grey line oscillating vertically at 1 Hz and at 15° retinal eccentricity was correctly seen as moving vertically when its contrast was high (all parts equally visible). However, when the line was made really dim—just above threshold—it appeared to move at 45°, at right angles to its own orientation. The ends became invisible at low contrast, losing their ability to resolve the aperture problem. Only the terminators reaching some criterion contrast can correctly determine the perceived direction of motion; otherwise they are ignored. This held for both dark-on-black and light-on-white configurations.

(2) In the converse case, the contrast of the ends and the middle of a line were pitted against each other by combining crossover motion with White’s effect. A titration method showed that the embedding lines immediately surrounding the bars were three times as important as the general surround in driving apparent motion. Lightening or darkening the embedding lines by 0.1 log units shifted the motion balance, and the surround had to be adjusted by 0.3 log units to redress the balance. Motion strength is therefore determined by contrast of the test bars against the embedding lines, not against the rest of the surround.
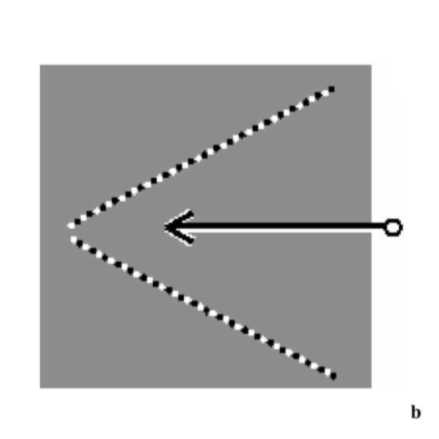
A final demonstration of contrast affecting perceived direction: two lines forming a shallow V appear to move toward each other when a pen tip is moved toward their apex—as expected from their true geometrical change in distance from the fovea. But two dotted lines forming the same V appear to move outward under the same conditions. The reason is that when a long straight line moves, motion along its length produces no retinal changes—the line is invariant under translation along its own axis—so only the orthogonal motion component is seen. For a dotted line, however, the contrast along the line (between black and white dots) is about twice the contrast across it (between dots and the mid-grey surround), so the along-axis motion becomes highly visible and predominates. The resulting perceived motion is the vector sum, and the dotted line appears to move nearly parallel to its own length.
-

Solid V-lines: appear to converge inward -

Dotted V-lines: appear to move outward
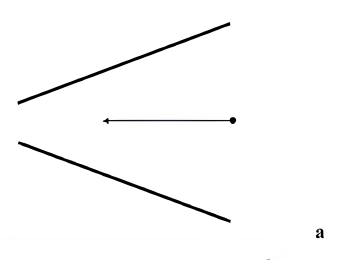

- Figure 8a. When an oblique black line moves horizontally, its motion decomposes into a vector along the line and one at right angles.
- Figure 8b. Since a straight line is invariant under motion along its axis, only the orthogonal vector is perceived, and the line appears to move at right angles to its own length (direction Φ).
- Figure 8c. A moving dotted line can be similarly decomposed into two vectors.
- Figure 8d. The along-axis vector is now seen or even overestimated (high dot-to-dot contrast), while the orthogonal vector is underestimated. Motion is perceived in direction O, closer to the line’s orientation.
3 Discussion
All the contrast-based illusions of motion described here are compatible with models of motion coding that use velocity-tuned neural units. Such units have been identified in primate visual area MT. Briefly comparing motion coding to color coding: just as three cone types encode wavelength as a ratio of firing rates, and that ratio compensation is imperfect (producing the Bezold–Brücke hue shift with changing luminance), so too might two sets of motion detectors—fast and slow—encode speed as a firing ratio. An increase in contrast would ideally raise the firing rates of both fast and slow detectors proportionally, preserving the encoded speed. However, if fast detectors grow more rapidly with contrast than slow detectors, apparent speed would increase with contrast—precisely the illusion observed. The contrast-dependence of perceived speed may therefore be a motion analog of the Bezold–Brücke effect.
A series of papers by Grossberg and colleagues offers a more sophisticated approach: their neural network model represents visual velocity as a distributed population code of speed-tuned units, where receptive field size is correlated with preferred speed, and larger cells have higher thresholds and compete in specific ways. Their model successfully simulates Thompson et al.’s data showing that higher contrast increases perceived speed, and can be extended to cover motion grouping and vector coding of motion. These models suggest that the wide range of contrast-induced motion illusions documented here and elsewhere reflect fundamental properties of speed coding in the early visual system.
References
- Adelson, E. H., & Movshon, J. A. (1982). Phenomenal coherence of moving visual patterns. Nature, 300, 523–525.
- Allman, J., Miezin, F., & McGuinness, E. (1985). Direction and velocity specific response from beyond the classical receptive field in the middle temporal visual area (MT). Perception, 14, 105–126.
- Anstis, S. M. (1998). Picturing peripheral acuity. Perception, 27, 817–825.
- Anstis, S. M. (2001). Footsteps and inchworms: illusions show that contrast affects apparent speed. Perception, 30, 785–794.
- Anstis, S. M. (2003). Levels of motion perception. In L. Harris & M. Jenkin (Eds.), Levels of Perception. New York: Springer.
- Anstis, S. M., & Mather, G. (1985). Effects of luminance and contrast on direction of ambiguous apparent motion. Perception, 14, 167–179.
- Anstis, S. M., Smith, D. R., & Mather, G. (2000). Luminance processing in apparent motion, Vernier offset and stereoscopic depth. Vision Research, 40, 657–675.
- Cavanagh, P., & Anstis, S. (2002). The boogie-woogie illusion. Perception, 31, 1005–1011.
- Chey, J., Grossberg, S., & Mingolla, E. (1997). Neural dynamics of motion grouping: from aperture ambiguity to object speed and direction. Journal of the Optical Society of America, 14, 2570–2594.
- Chey, J., Grossberg, S., & Mingolla, E. (1998). Neural dynamics of motion processing and speed discrimination. Vision Research, 38, 2769–2786.
- Fry, G. A. (1983). The Bezold–Brücke phenomena at the two ends of the spectrum. American Journal of Optometry and Physiological Optics, 60, 977–981.
- Gibson, J. J. (1950). The Perception of the Visual World. Boston: Houghton Mifflin.
- Grossberg, S., Mingolla, E., & Viswanathan, L. (2001). Neural dynamics of motion integration and segmentation within and across apertures. Vision Research, 41, 2521–2553.
- Grossberg, S., & Rudd, M. (1992). Cortical dynamics of visual motion perception: short-range and long-range apparent motion. Psychological Review, 99, 78–121.
- Ito, H., & Anstis, S. M. (2002). Motion after effects from illusory movements of second-order contours. ECVP Presentation, Glasgow, Scotland.
- Mather, G., & Anstis, S. (1995). Second-order texture contrast resolves ambiguous apparent motion. Perception, 24, 1373–1382.
- Maunsell, J. H. R., & Van Essen, D. C. (1983). Functional properties of neurons in the middle temporal visual area of the macaque monkey. Journal of Neurophysiology, 49, 1127–1147.
- Mikami, A., Newsome, W. T., & Wurtz, R. H. (1986). Motion selectivity in macaque visual cortex. II. Journal of Neurophysiology, 55(6), 1328–1338.
- Nakayama, K. (1985). Biological image motion processing: a review. Vision Research, 25, 625–660.
- Pridmore, R. W. (1999). Bezold–Brücke hue-shift as functions of luminance level, luminance ratio, interstimulus interval and adapting white for aperture and object colors. Vision Research, 39, 3873–3879.
- Stone, L. S., & Thompson, P. (1992). Human speed perception is contrast dependent. Vision Research, 32, 1535–1549.
- Thompson, P. (1982). Perceived rate of movement depends on contrast. Vision Research, 22, 377–380.
- Thompson, P., & Stone, L. S. (1997). Contrast affects flicker and speed perception differently. Vision Research, 37, 1255–1260.
- Thompson, P., Stone, L. S., & Swash, S. (1996). Speed estimates from grating patches are not contrast-normalized. Vision Research, 36, 667–674.
- Walls, G. E. (1942). The Vertebrate Eye and Its Adaptive Radiation. New York: Hafner.
- Zeki, S. M. (1974). Functional organization of a visual area in the posterior bank of the superior temporal sulcus of the rhesus monkey. Journal of Physiology, 236, 546–573.
Rotating Rings with Patrick Cavanagh

The texture filling the rings is either stationary (rings seem to move slowly) or moves in the opposite directions to the rings (rings slide over each other, each spinning CCW as the pair turn CW) or in the same direction as the rings (rings appear to move very fast as a rigid
The rings appear to slide over one another when the intersections are dark so that they obey Metelli’s transparency rules. They lock together into a rigid trefoil when the intersections are light and look opaque…..
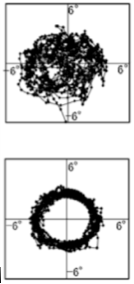
Eye-movement tracked while watching the stimuli. (top representing right rings, bottom representing left)
Left-hand rotating rings with painted-on spots were parsed as a solid figure of eight. Observers could easily track rigid intersection (lower right graph) (Anstis & Ito, Perception 2011).
Right-hand rotating rings with vertically aligned gaps or spots appeared to slide. Observers could not track sliding intersection where rings cross. Upper right-hand graph shows the noisy pattern of eye movements.
No flies on Rama: The flying bugs illusion
These two bugs fly clockwise along circular orbits of the same size, in all 3 movies. They are in counter phase; one is at 6 o’clock when the other is at 12 o’clock.
The orbits look elliptical, wide on the left and tall on the right. The background moves CCW and is in counter-phase with the horizontal components of the left fly but the vertical components of the right fly.
Flash-Grab
With PATRICK CAVANAGH
Motion undershoot. Bar rotates through 180°, from 12 to 12 o’clock. But it appears to move only from 1 to 11 o’clock.
Same as the ring but for linear motion. Red and green bars are in the same position but appear to be offset. Try tracking them with your eyes; your eyes feel as if they move, but they really don’t!!
Same idea here! Right-angled cross looks wonky because moving sector edges shift the cross arms more than moving middles of sectors.
Local and Global Motion with Juno Kim
At first, this ambiguous motion stimulus looks like four pairs  of dots, each rotating about their common center, but after a while it perceptually reorganizes into two large squares (with a dot at each corner) floating over each other. These local and global forms of “common fate” often alternate; on a 30s trial, local motion is usually seen first, followed by global motion. And across a series of trials, global motion is gradually seen more often. This suggests two adaptation (or learning) processes with different time constants.
Above: These cubes are readily organised perceptually into two large squares
Conversely, the lovers gazing into each other’s eyes are seen not as a large female square and large male square but as locally moving pairs.
Each pair of spots is phase shifted by 45 degrees from its neighbors. The blue circles tend to constrain the pairs to remain local
Without the circles, one perceives two intertwined global octagons.
Color Afterimages


with ROB VAN LIER and MARK VERGEER
Gaze steadily at the cross, ALWAYS! Without moving your eyes, note the colors of the squares (red, green, blue, yellow). Every so often, different colors will flash up briefly. These colors are afterimages–not on the screen, but in your head!
The adapting plaid, below, consists of a blue/yellow vertical grating, superimposed on a red/cyan horizontal grating. After adapting to this plaid, vertical black test lines make the afterimage look yellow/blue, while horizontal test lines make the after image look cyan/pink. Thus one and the same adapting pattern gives differently colored afterimages.
Conclusion: the visual system averages after image colors within but not across luminance test contours.
Below, second-order test stripes defined only by motion give the same BY and RC afterimages. These are not first-order test contours defined by luminance, but are second-order contours defined only by motion. But the horizontal bars still look blue/yellow and the vertical bars look red/green.
Above: The “+” test field looks red and green, while the “Tic-Tac-Toe” test field looks blue and yellow. All from one and the same adapting field.